


Fixed Income Insights: Implications from trade war and a dovish Fed
08-07-2019
Over the second quarter, markets have been dominated by volatility with increased tariffs, concerns over escalating trade war that will disrupt the global supply chain and cut into the profits of multinationals and small businesses. Interestingly, both broad Asian bond market and U.S. treasury market went up in the second quarter. Both credit market and U.S. treasury market rallied after Federal Reserve (Fed) Chairman Jerome Powell implied the Fed is open to rate cut in the recent FOMC press conference as well as optimism fueled by a potential China-U.S. trade truce. We expect Fed rate cut under a full-blown trade war scenario. In our view, with or without a trade deal, the continuous conflict between the U.S. and China is becoming a “new normal”, as the two nations battle for global supremacy on economic, geopolitical and technological fronts. In the current environment, we prefer to stick to an income theme and be cautious of duration risk.
Figure 1: Asian Bond Indices remained resilient
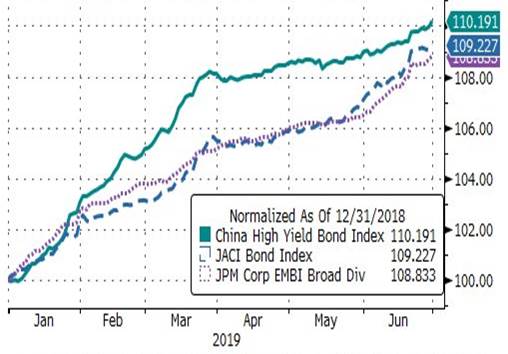
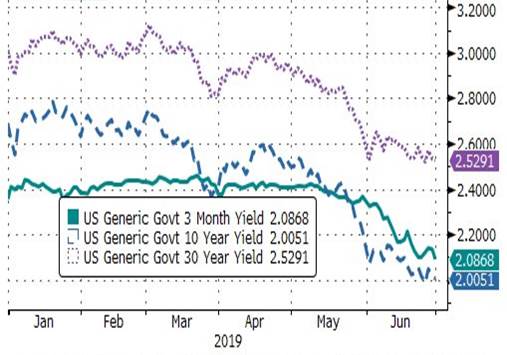
Figure 2: U.S. Treasury Yields reaching YTD lows
Chinese high yield bond broad market and global emerging market debts increased about eight to ten percent so far this year. China policy makers have been supportive and continued to stimulate the economy and support the financial market. In June, China’s Ministry of Finance said that it planned to ease restrictions on how the proceeds from special-purpose local government bonds were spent and encourage banks to offer loans to project funded by such debt. We continue to believe China bond market will be continued to be supported by the arrival of new investors in China’s domestic bonds as the country’s government and policy-bank joined Bloomberg index in April. The fresh impetus comes from the phased inclusion of Chinese sovereign bonds and debt sold by three key state-owned policy banks into the Bloomberg Barclays Global Aggregate Index, starting in April 1.
Asia bonds rallied in 2Q mainly at the back of US treasury rally. Growing external pressures, escalation of tariffs and low inflation point to a new wave of easing in Asia with Reserve Bank of India cutting interest rates in by 75bp since February. Benign election outcome from India and Indonesia and S&P upgrade on Indonesia sovereign also supported risk assets from the region despite concerns on liquidity troubles from non-bank financial institutions and Fitch downgrade on selected banks in India. Outside of Asia, we have also witness rate cuts in Chile by 50bp and Russia by 75bp so far in 2019 with more difficult global backdrop and disappointing domestic activity dynamics. Election uncertainties in Argentina, pension reform progress in Brazil, S400 crisis in Turkey with potential US retaliation, and geopolitics in Middle East will create near term volatility in emerging markets.
Global Investment Outlook
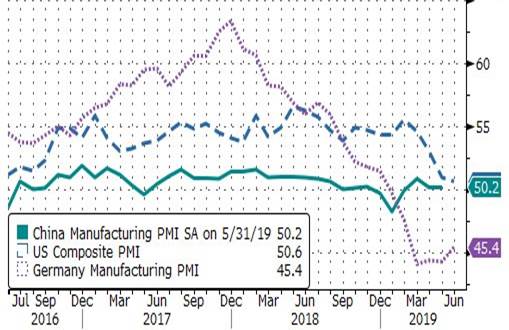
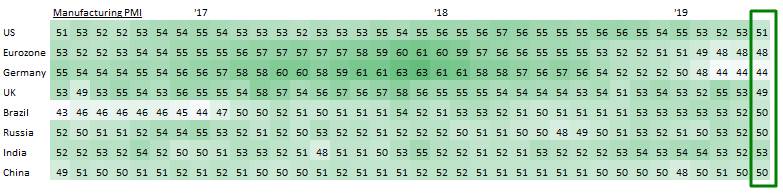
While China Manufacturing PMI Index continued to hover between growth and contraction, U.S. Composite PMI and Germany Manufacturing PMI fell significantly in the past six months amid of global trade wars. In our view, with or without a trade deal, the continuous conflict between the U.S. and China is becoming a “new normal” and will continue to threaten global economic growth, as the two nations battle for global supremacy on economic, geopolitical and technological fronts. In the current environment, we prefer to stick to a income theme and be cautious of duration risk.
Figure 3: Major economies growth slowed down as countries are dealing with global trade wars
U.S. Dollar Index (DXY) has been strong so far this year until end-May amid higher trade war risk as well as potential Fed rate cut. According to Citibank, USD selloffs into rate cuts on average historically began 1-2 months before rate cuts and amount to around 3.5% on average. Coincidentally, copper price had rallied during this period until May as escalated trade war has big implication on global economic growth. Given the outcome from the recent G20 meeting, we think investors will continue to monitor if US and China can find more common ground and avoid a full-blown trade war.
Figure 4: Strong USD had coincided with drop in oil and copper prices until end-May
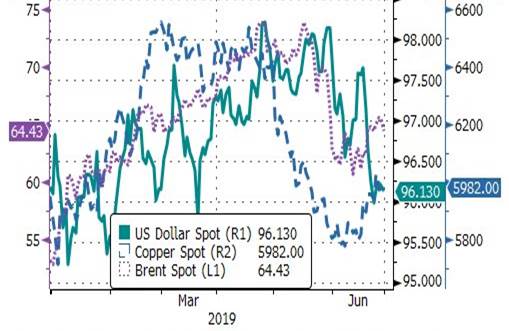
In terms of oil prices, while we continue to believe the worst is behind us as oil prices have rebounded from as low as US$27 per barrel back in February 2016, we reckon higher trade war risk and hence revise our Brent year-end target to US$55-65 per barrel. In the coming OPEC-plus meeting in July, we expect the group to continue to balance the oil market before 2020. We turn more cautious on oil prices also because recently reported US crude oil inventories have higher than their five-year. However, we see limited upside in US oil production (1) when the company’s management team’s annual remunerations are directly linked to it; and (2) amid reports on companies increase drilling “child wells” rather than their parent as these might result in long term production pains. Hence, we see low probability of low oil price levels such as back in 2016.
In terms of interest rates, we revise down our 10-year U.S. government bond yield year end target to 2.40% as we continue to monitor US economic data post G20 meeting. But we are prepared to further revise down our target if we see a full-blown trade war. In terms of credit risk, Moody’s highlighted that 2018 no-financial EM corporate bond default rate was only 1.4 percent, the second lowest figure since 2012. Moody’s predicted that the global default rate might pick up a little in the second half to reach 1.5 percent, but still below the long-term average. We think portfolio diversification and positioning will continue to be crucial going forward.
Chinese Onshore Bond Market
Review of China’s Economic and Policies and the RMB Bond Trends
At the end of Q1, market expected Chinese economy began to stabilize given the better economic data. In April, Chinese economy achieved initial stabilization and policy makers turned towards “wait and see” mode. The RMB bond market faced pressure to a certain extent. Sino-U.S. trade frictions intensified in May, the Chinese government re-launched a number of policies to stabilize the economy and boosted the RMB bond market. In June, the Chinese authorities gradually increased their hedging policies, but the downward pressure on the economy has not been alleviated. In addition, the impact of Sino-U.S. trade conflicts continued to be supportive to the RMB bond market. However, inflation expectations have risen under the impact of supply-side reforms. After the “Baoshang incident”, the passive de-leverage of small and medium-sized financial institutions have triggered liquidity shocks, which has brought pressure on the bond market.
In terms of interest rate bonds, the curve in the second quarter has gradually flattened and the yields across the curve declined to varying degrees. Rising trend of yield at the end of the quarter was mainly affected by the pressure on local government debt supply. We still be positive on interest rate bonds in Q3 given the yield spread between US and Chinese treasury, but the declining space for the yield of Chinese interest rate bond is not very big.
Figure 5: China Government Bonds and China Development Bank Bonds
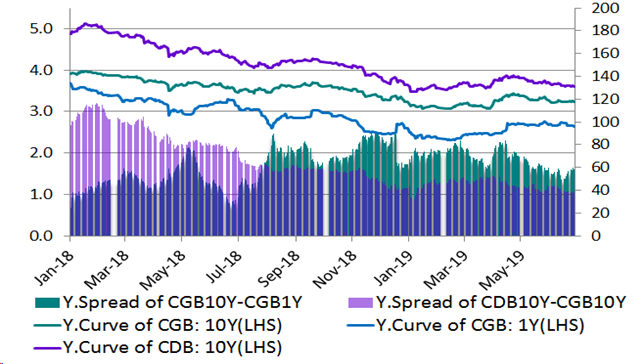
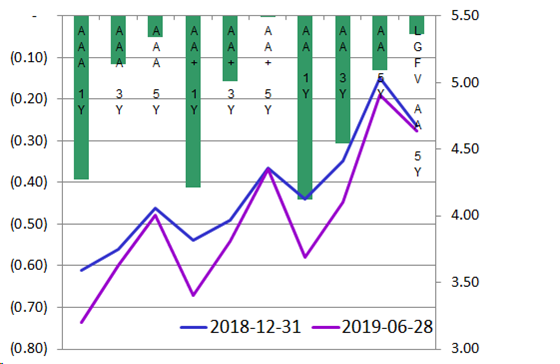
In terms of credit bonds, the total amount of financing in the second quarter increased year-on-year, but the structural differentiation was quite obvious. Investors have lengthened their duration on high-rated credit bonds, while the duration of low rated bonds were shortened. It shows that investors still maintain a cautious stance towards overall credit risk.
Figure 6: Chinese Onshore Credit Bonds
Third Quarter Outlook
The Chinese government has adjusted its economic policies to respond more actively to external shocks. Due to the lagging effects of economic policies, the economy may show signs of stabilization in the third quarter. However, subject to inflation, housing prices, debt and other constraints, the actual growth rate of GDP may be at the lower side of the target range of 6-6.5%. The relationship between the economic development momentum and the policy intensity will continue to affect the RMB bond market in the third quarter. We see low probability of monetary policy conversion in the third quarter and liquidity should remain moderately loose. And these will be positive for the overall interest rate. We expect risk pricing to be gradually reasonable as we might see credit spread widening in coming quarter.
Chinese Offshore Bond Market
The property sales in 1H showed strong growth with large developers achieved 24% YoY sales growth on average (vs. potential low single-digit decline for national sales) and 47% target completion run-rate for annual sales target. We expect the strong sales momentum to be more resilient than expected as 1) the market demand remains solid, especially under ASP control, but also with more launches for faster sales/cash; and 2) the policy outlook remains stable with a higher-frequency, narrower-range & city-specific pattern. We think it is less likely that meaningful loosening will come given the land and property prices have both been rising in 1H19. However, it is also unlikely to tighten much from current stance given the economy pressure under the backdrop of the macro uncertainties.
However, the recent headlines have been showing that the regulators will monitor developers’ land acquisitions more closely and keep a tightening bias on any excessive lending to the sector. It means the onshore funding channel would remain open subject to the developers’ behavior and we expect it to be largely stable. We think the refinancing risks in 2H19 will be manageable for the sector given the significant amount of front-loaded financing in 1Q19.
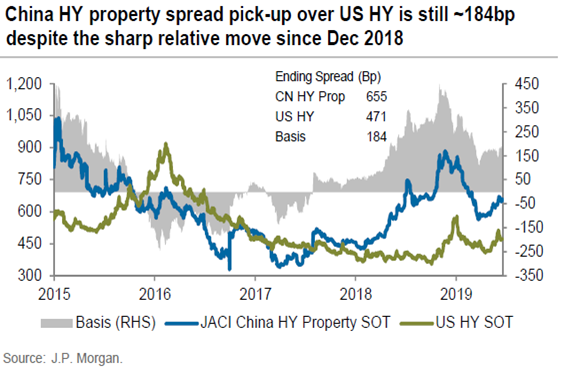
In terms of valuation, China HY property spread pick-up over US HY has retraced materially from the high level in December 2018 to around 184bps currently. But it still remains relatively attractive compared to 2016-2017. After the significant amount of net supply of more than USD 25bn in 1H19 (vs. USD 28bn total net supply in 2018), we are back in neutral in terms of technicality, with the expectation of another leg to go in terms of offshore new supply if the market remains firm. That said, with the rates remain lower for longer, we see the carry theme remains valid for the sector with 8.2% YTW (as of June 21st, 2019) for JACI China Property High Yield Index vs. 7.1% for JACI High Yield Corporate.
Figure 7: China offshore USD high-yield property bond supply
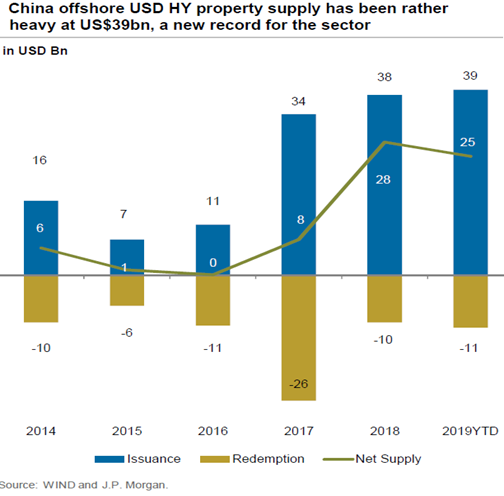
Figure 8: China high-yield property bond spread
In China we are seeing more default / restructuring with Baoshang Bank taken over by the Chinese government citing serious credit risks while Tewoo Group (a wholly owned entity of Tianjin SASAC) was rumored to have engaged in talks with creditors about debt restructuring. In addition, Qinghai Provincial Investment Group (QPIG) reports RMB 2.81B in overdue onshore debt which has likely triggered cross defaults under US$300M 7.25% 2020 and US$300M 6.4% 2021 offshore Bonds. It is important to emphasize that the overall default rate in China is still very low and the pickup in default is largely expected as China’s growth slows. With the government having a firm grip over the economy and ample room for the PBOC to ease, the situation presents very interesting alpha generating opportunities.
We are spending more time in China industrial names as some value starts to emerge. We are also trying to capture pocket of onshore opportunities as onshore enters into the seasonal liquidity tightness post Baoshang incident.
Special topic – trade war and its implications
Figure 9: Global manufacturing PMI
On March 22, 2018, Trump asked the U.S. trade representative (USTR) to investigate applying tariffs on US$50–60 billion worth of Chinese goods including aircraft parts, batteries, flat-panel televisions, medical devices, satellites, and various weapons. Ministry of Commerce of China responded by imposing tariffs on 128 products it imports from America, including aluminum, airplanes, cars, pork, and soybeans, as well as fruit, nuts, and steel piping on April 2, 2018. And that was how 2018 global trade war started. Subsequently, the Trump administration has imposed and threatened several rounds of tariffs to several countries including China, Japan, India, Canada and Mexico, and other countries have responded to these measures. The latest tariffs involve potential tariff increase to 25% from 10% levied in $200 billion worth of Chinese goods and Chinese tariffs on $60 billion worth of US goods.
These series of tariffs and retaliations would have big implication to global economic growth as well as financial markets. According to a poll by Bloomberg in June 2019, the standoff between President Donald Trump and Chinese counterpart Xi Jinping emerged as the biggest challenge facing money managers. Global financial market has been paying attention on the trade war between the U.S. and China. The U.S. mainly targeted high-end products, while China low-end ones. The U.S. wants to hurt China’s high-tech sector while protecting its consumers, whereas China cannot afford targeting high-end products, especially aircraft. The U.S. is limiting China’s ability to invest there and buy technology, and that it would be hard for the U.S. to be a threat to China on tax competition.
According to the U.S. Tax Foundation, the tariffs planned and imposed so far by the Trump administration would reduce long-run GDP by 0.20 percent ($50.31 billion) and wages by 0.13 percent and eliminate 155,878 full-time equivalent jobs. If the Trump administration acts on threats to place new tariffs on automobiles and parts and additional tariffs on products from China, GDP would fall by an additional 0.45 percent ($112.23 billion), resulting in 0.30 percent lower wages and 347,988 fewer full-time equivalent jobs. Other countries have announced intentions to impose tariffs on U.S. exports. If these tariffs are fully imposed, the foundation estimates that U.S. GDP would fall another 0.09 percent ($21.53 billion) and cost an additional 66,725 full-time equivalent jobs. If all tariffs announced thus far were fully imposed, U.S. GDP would fall by 0.74 percent ($184.07 billion) in the long run, effectively offsetting about 44 percent of the long-run impact of the Tax Cuts and Jobs Act. Wages would fall by 0.48 percent and employment would fall 570,591.
In terms of impacts to other countries, the EU could gain in relative terms, if China and the US continue with their trade war. Europe’s gains in the Chinese market would mostly be related to the motor vehicles sector, while gains in the US market would be more broad-based and larger. On the other hand, countries like Vietnam, Taiwan and Chile have emerged as the winners of the trade dispute between the world’s biggest economies as companies like Apple leave China for more profitable markets. However, we would like to emphasize that there are no real winners in this US-initiated trade war. Countries facing new tariffs, including the U.S., experience declines in real exports and GDP. Other countries are hit indirectly through weaker demand for their own exports, either through supply chains or in response to weaker global economic growth. These effects outweigh any potential gains from trade diversion to avoid tariffs.
According to IHS Markit, in the protectionism scenario, the level of global real GDP is reduced 0.1% this year, 0.8% in 2019, and 1.4% in 2020. World trade suffers in a more protectionist environment, as countries turn inward and multinational companies move production to end markets to stay competitive. In the scenario, real global exports of goods and services are 2.4% below the baseline level by 2020. The sharpest declines in real exports occur in China and the three North American countries. We think a full-blown trade war will increase recessional risk significantly. However, we disagree with talks that relate the current trade war to the Great Depression in the 1930 where Smoot-Hawley Tariff increased 900 import tariffs by an average of 40% to 48% and the trade war reduced international trade by 65%. As shown by the chart above, global economies, except European countries, are still printing manufacturing PMI readings above 50 which indicate expansion.
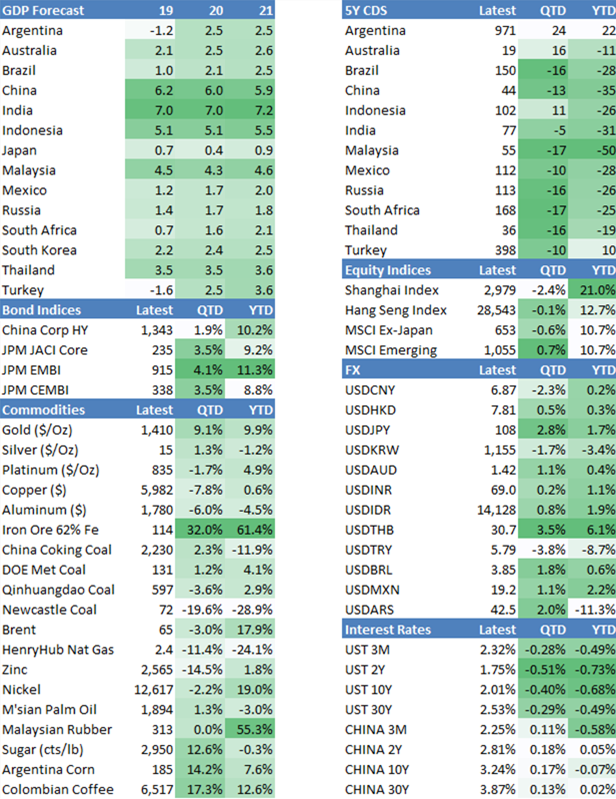
Figure 10: Economic and Market Data
*Source of data/charts: Bloomberg, JPMM.com, Chinabond.com.cn and VP internal resources
The views expressed are the views of Value Partners Hong Kong Limited only and are subject to change based on market and other conditions. The information provided does not constitute investment advice and it should not be relied on as such. All material has been obtained from sources believed to be reliable as of the date of presentation, but its accuracy is not guaranteed. This material contains certain statements that may be deemed forward-looking statements. Please note that any such statements are not guarantees of any future performance and actual results or developments may differ materially from those projected.
This commentary has not been reviewed by the Securities and Futures Commission in Hong Kong. Issuer: Value Partners Hong Kong Limited.
For Singapore investors: This commentary has not been reviewed by Monetary Authority of Singapore. Value Partners Asset Management Singapore Pte Ltd, Singapore Company Registration No. 200808225G.