


Fixed income insights: Unlocking yields amid uncertainties
26-04-2019
Over the first quarter, global economic developments have been eventful yet positive, in our view. Both broad Asian bond market and U.S. treasury market rallied in the first quarter and S&P 500 had its best quarter in ten years. We reckon that the U.S. Federal Reserve’s cautious stance on raising interest rates created uncertainty in the economy and potentially hurt the U.S. central bank’s credibility. And that was the main reason that the U.S. treasury yields fell in March despite global economic data continued to show continued growth across the global. Global risk assets paused its strong rally in the last week of the Quarter amid of (1) uncertainties from U.S.-China trade war negotiation; (2) Federal Reserve’s sharp turn away from steady rate increases; (3) lower-than-expected U.S. economic data e.g. the New York Empire State Manufacturing Index and Housing Starts; and (4) continued contraction in Germany’s manufacturing sector.
Figure 1: Asian Bond Indices have remained strong
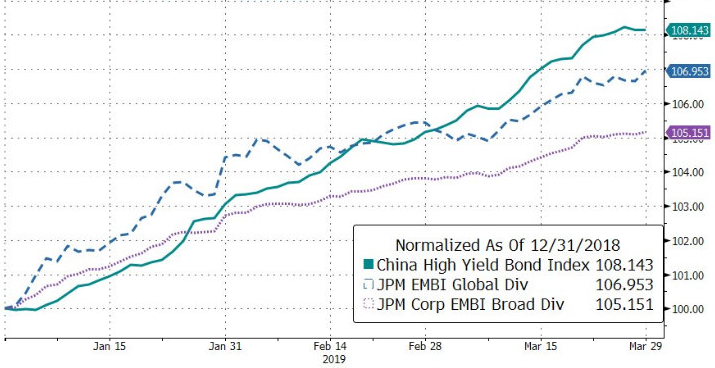
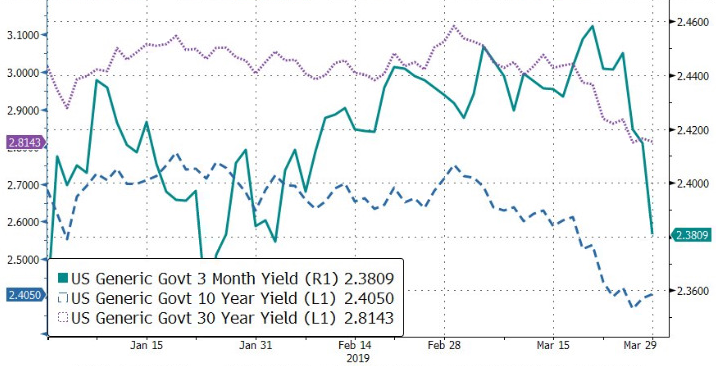
Figure 2: U.S. Treasury Yields fell significantly
Chinese high yield bond broad market and global emerging market sovereign debts increased about seven percent in the first quarter while global emerging market corporate debts increased about five percent. China policy makers have been supportive and continued to stimulate the economy and support financial market. Although the country lowered its goal for economic growth to 6-6.5% from 6.6% during its National People’s Congress, policy makers unveiled tax cuts of US$298 billion or 2 trillion yuan; announced infrastructure spending; and continue to help loan growth with 2.15 trillion yuan of special local government bonds. Strong performance of China bond market could also be helped by the imminent arrival of a new group of investors in China’s domestic bonds as the country’s government and policy-bank notes is going to join Bloomberg index in April. The fresh impetus comes from the phased inclusion of Chinese sovereign bonds and debt sold by three key state-owned policy banks into the Bloomberg Barclays Global Aggregate Index, starting in April 1.
Asian bond market has performed in the first quarter even with many elections within the region e.g. Thailand, Indonesia and India. As highlighted by Bloomberg, history shows not only do the markets tend to gain in the run-up to a ballot, they also tend to climb further after. Indonesia will hold presidential and general votes in April, while the Philippine’s midterm ballot will take place in May. However, we saw Indonesia bond market was one of the best performing bond markets in the first quarter. Asian giant, China also performed well during the period mainly due to supportive monetary and fiscal policies. The Chinese offshore property bond market has been delivering too since beginning of the year as the sector is supported by multiple positive signs e.g. rising primary sell-through rate in Tier-1 cities; higher ASP of new launches; and downward trend in mortgage rate. During first quarter, countries like Brazil, Mexico and Nigeria have enjoyed post-election risky asset rally as investors expect political stability, further economic stimulus and certain reform such as pension reform in Brazil. The only exception would be Turkey as its debt market dropped together with Turkish lira after a major liquidity squeeze that pushed the London swap rate to record 1,200 percent. However, we saw short squeeze and sharp rebound of Turkish bonds on the last day of trading day in the first quarter as Turkey CDS tightened almost 90bps from as high as 517bps. The global emerging market rally on that day was mainly helped by constructive messages sent out by both U.S. and China trade war negotiators.
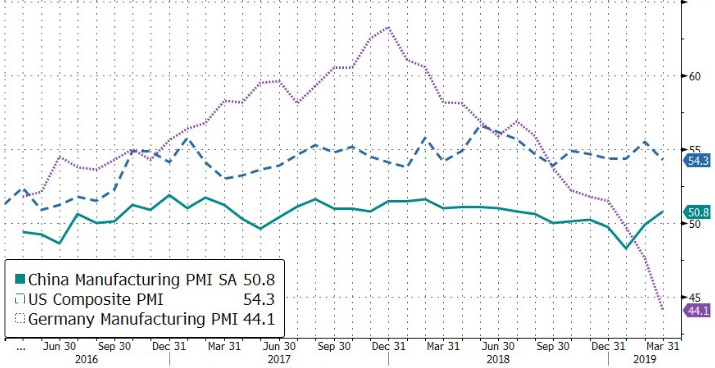
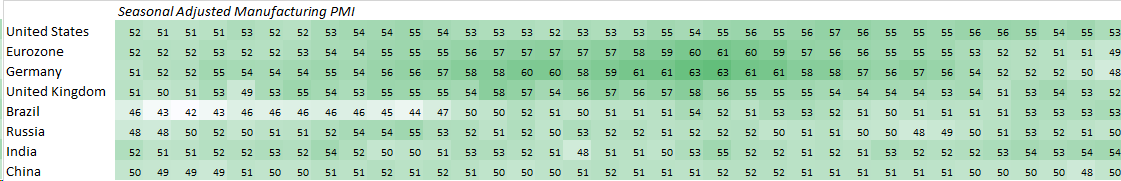
While China Manufacturing PMI Index remains solid and U.S. Composite PMI continued to hover between growth and contraction, Germany Manufacturing PMI has been hit since end of 2017 amid of trade war with U.S. We believe that as long as the data adds up to economic expansion on a worldwide level, we will continue to see the status quo rolling and companies can shift resources to the growing segments. We also reckon that Asia as a whole accounts more than 50% of all global GDP growth.
Figure 3: Major economies growth slowed down as countries are dealing with global trade wars
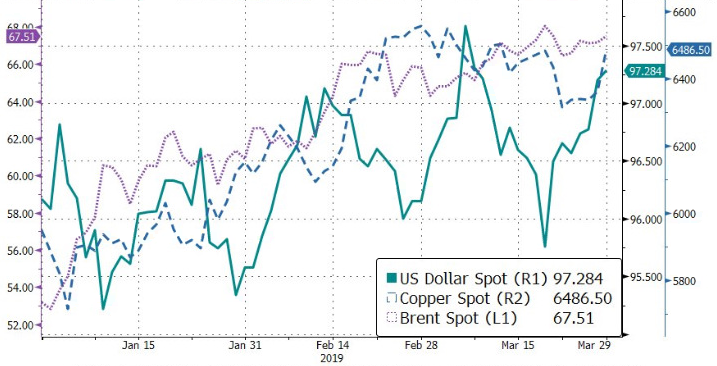
U.S. Dollar Index (DXY) has been strong in first quarter mainly driven by uncertainties in Europe such as Brexit and higher U.S. interest rates expectation. However, DXY was unable to prevent oil prices and “Dr. Copper”, which is often a good predictor of a shift in the economy, from moving higher. We recognise that copper prices has been boosted by supply shortfall on top of accelerated demand from China as well as demand from Europe, Japan and southeast Asia.
Figure 4: Strong U.S. Dollar was not enough to eliminate strength in oil and copper prices
In terms of oil prices, we continue to believe the worst is behind us as oil prices have rebounded from as low as US$27 per barrel back in February 2016 and we set a year-end target of US$70-75 per barrel for Brent. In a meeting last month, OPEC-plus concluded that markets are roughly in balance and pledged to withhold about 1.2-million barrels a day of oil supply this year to prop up markets amid Trump OPEC tweet callings for oil cartel to boost production. We notice that U.S. crude oil rigs have been falling since December 2018 while U.S. onshore oil players are pushing for higher production. We see this higher production as temporary and “dangerous” especially (1) when the company’s management team’s annual remunerations are directly linked to it; and (2) amid reports on companies increase drilling “child wells” rather than their parent where share might result in long term production pains.
Figure 5: Risk Appetite Index dropped below 0.5
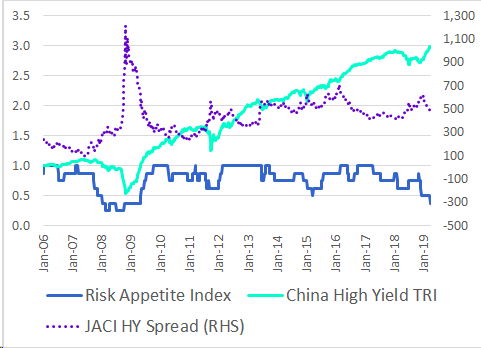
Our internal Risk Appetite Index (RAI) dropped below 0.5 (range = 0 to 1) and this is not a good sign for risk assets based on history. We think portfolio diversification and positioning would be crucial during this period. However, we reckon that China high yield credits are able to generate good returns in long run.
In terms of interest rates, we expect 10-year U.S. government bond yield to increase to 2.77% in coming three quarters based on current Federal Reserve Fund Rate as well as U.S. economic data. We would like to highlight that normally economic data bottoming lags around three quarters compared to broad market of risk asset prices.
Chinese Onshore Bond Market
The economic data in 1Q showed that the economic start of this year was slow yet steady. We expect continued downward trend and trade activities dragging down on the economy. Easing of the monetary policies remained unchanged and overall liquidity remained sufficient. In terms of fiscal policy, the supporting role of infrastructure was limited, and we do not expect near term rebound. Chinese government plan to issue large amount of special government bonds to increase the local construction investment but also can keep the deficit rate below 3%. FY19 deficit rate is expected to increase to 2.8% from 2.6% of 2018.
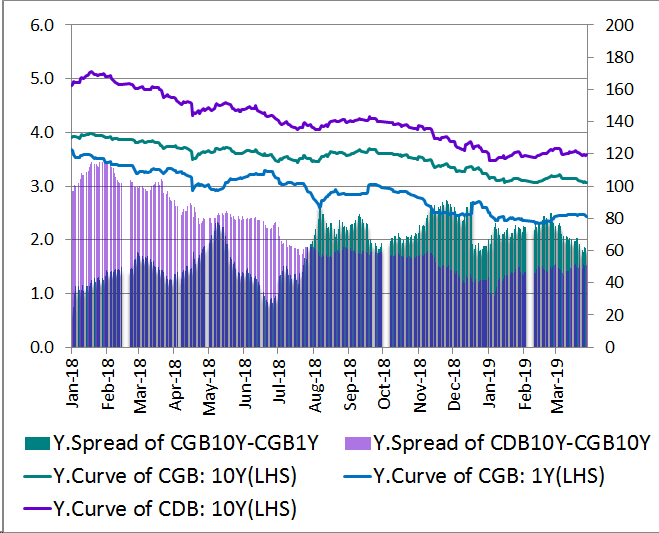
The overall interest rate curve flattened in 1Q, but was relatively stable compared to last year. With the increasing expectation of economic data improvement, we are cautious about this asset.
Figure 6: Interest Rate Bonds and China Development Bank Bonds
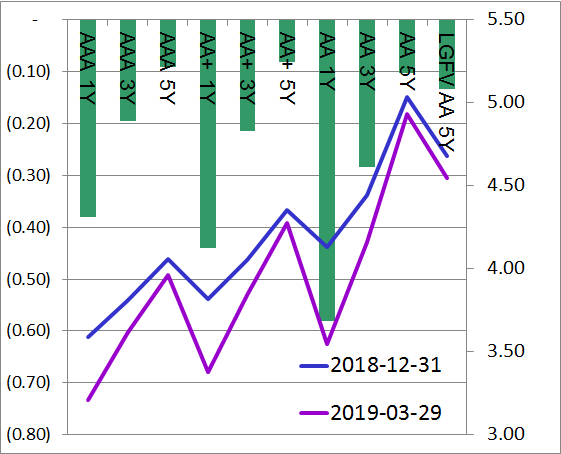
Although the total financing amount of credit issuers in primary market increased year on year, the structural differentiation is still obvious. The net financing of low-rating issuers and non-SOE issuers were negative. For these enterprises, the refinancing pressure remains. The yield curve of credit bonds also continued the downward trend of last year. Given liquidity loosening, we see higher downward pressure on yields of short dated bonds compared to the long dated bonds. The market remains worried about the long-term credit risk. The long-term credit spreads have not improved and overall curves have steepened. 9 onshore issuers defaulted in the first quarter, all of which were private enterprises. The onshore company default somehow slowed down but we do not see substantial improvement, at least in near future.
Figure 7: Chinese Onshore Credit Bonds
As the Chinese dollar bond market soared, spread between USD bonds and RMB bonds, issued by the same issuer, narrowed and some names even show no spread or negative spreads. But the yield of Chinese USD bonds is still very attractive, and we can see more flows to offshore USD bonds market from onshore.
We are cautious about onshore bond market in the second quarter, since the economic data of April are expected to improve. But due to the increase in liquidity gap, the market expects further RRR cut. We still see optimism towards performance of convertible bonds. In addition, we are looking for some industry or regional leaders that have been neglected. With the improvement of the financing environment, market may increase their risk preference to obtain excess returns. We think offshore investors could take advantage of China-US interest rate differential besides interest rate bonds given the adding in the global index.
Chinese Offshore Bond Market
In terms of offshore property bonds, we expect physical market continue to recover led by first and second tier cities (T1/2). Listed property names have generally conveyed a confident tone on FY19 sales outlook. Most of these companies have allocated more resources to new launches for coming quarters on expectation of reviving market sentiment and higher selling prices. Multiple positive signs have been shown in T1/2 markets including (1) primary sell-through rate in Tier-1 cities rising to c. 80%; (2) ASP of new launches that increase 5-10% after the fine-tuning policies; and (3) mortgage rate that continues to trend down (an average of 5.63% in February from the peak of 5.71% in November 2018).
Figure 8: JACI China Properties
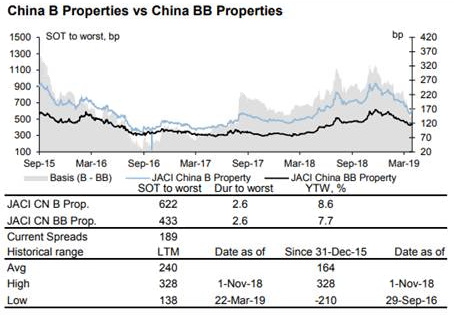
After the strong rally of the sector in 1Q, we expect spread tightening to slow down in 2Q but market remains attractive as a carry play. Supply pressure would resume after the result season given the onshore high yield market has not shown a strong recovery compared to the offshore market. The spreads for benchmark BB and higher quality B property bonds have tightened to around the past three-year historical average. However, we see the macro environment to remain supportive and expect concerted monetary policy easing actions and further fund flows to continue supporting global credit asset performance. We also see good relative value in the short duration lower single B names that provides decent carry with lower volatility.
The offshore industrial space remains weak and unloved by the market in general as we saw multiple offshore bond issuers in this space defaulted in the past six months. The common theme of defaults was due to highly levered businesses and some degree of fraud / overstatement of financials which were exposed as the Chinese government pushed for deleveraging for the most part of 2018.
Our view is as defaults started to emerge, the space is bottoming out as (1) the Chinese government has shifted gear and turned to an easing stance especially towards industry leaders; and (2) most of the prime default candidates have either defaulted or worked out a solution to handle their dues. In addition, we view the emergence of defaults as a good learning process for offshore market which will eventually translate into better issuance quality.
Figure 9: JACI China Properties and Industrials
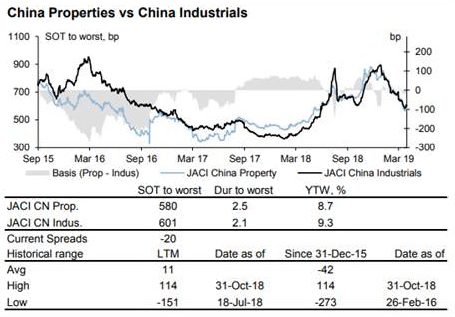
We see relative value in this space vs. Chinese properties names and alpha play in selected industrial names as they deleverage by introducing strategic investors (often time SOEs) or asset disposals.
Figure 10: Major DM and EM Manufacturing PMI
On 22nd March 2019, the yield for 10-year Treasuries fell below that for 3-month Treasuries, marking the first appearance of such an inversion since 2007, months before the financial crisis triggered a stock market rout. Generally, investors believe that if it stays that way, on average, for a quarter, history suggests we see a recession within 18 months. Regarding sharp plunge in bond yields on 22nd March, Bloomberg reported that it might due to a massive wave of hedging in the swaps market. Mortgage and hedging activity from programmatic gamma sellers are likely to keep swap spreads very directional with rate moves and intensified the magnitude of rate plunge.
Figure 11: 3m-10y Treasuries spread remains above zero if adjusted for term premium
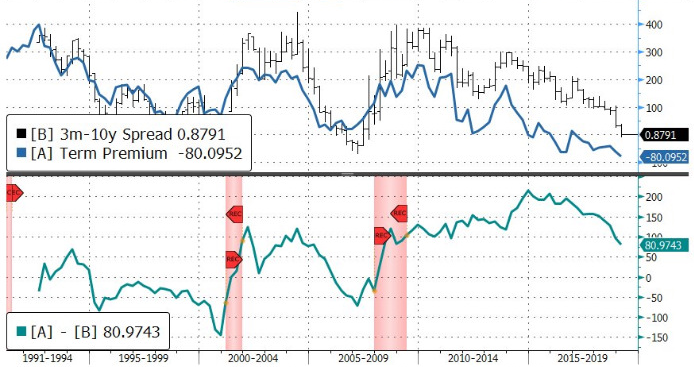
While we are aware of market’s belief in the inverted yield curve’s ability in predicting recession, but we think it is premature to panic. We reckon there are some unique factors this time as we are having negative term premium unlike previous inverted yield curve periods. Term premium is the bonus that investors traditionally received for the added risk of owning longer-term bonds. But today, investors pay a premium to hold long-term bond as a hedge to deflation. Term premia are very sensitive to the expected future path of growth, inflation/deflation, and monetary policy. We will be more convinced if yield curve is still inverted after adjustment for term premium. And a sudden turn of such negative term premium-adjusted yield curve could well lead to another recession.
During a Bloomberg interview, Nobel laureate Robert Shiller said inverted yield curve is overrated as an indicator to predict a recession. He thinks inverted yield curve, to some extent, could be linked to data mining as there were not many recessions since 1957 and there are indicators worked for certain recessions but not recessions in the future.
According to the table shown above, most major developed market and emerging market economies are still in expansion territories except Eurozone that has not really recovered fully from European debt crisis in our view. In addition, the region has been affected by U.S. trade war.
Figure 12: U.S. Regional Macro Composite rebounded
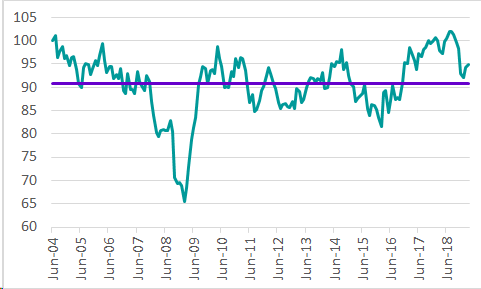
Our internally compiled U.S. Regional Macro Composite Index (RMCI), which is derived from data such as U.S. Empire State Manufacturing, Philadelphia Fed Business, Richmond Manufacturing Survey, Chicago Fed National Activity, etc., has rebounded lately and we will be more concerned if RMCI drops below long-term average.
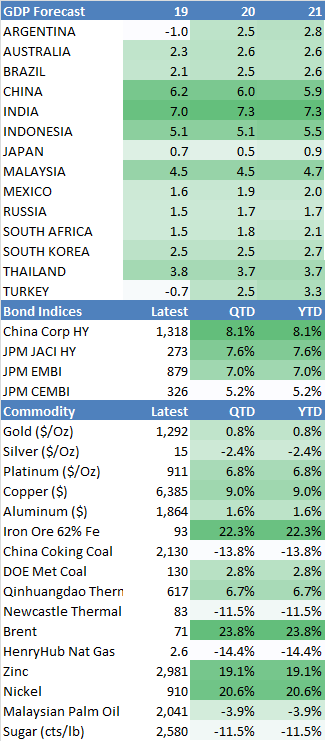
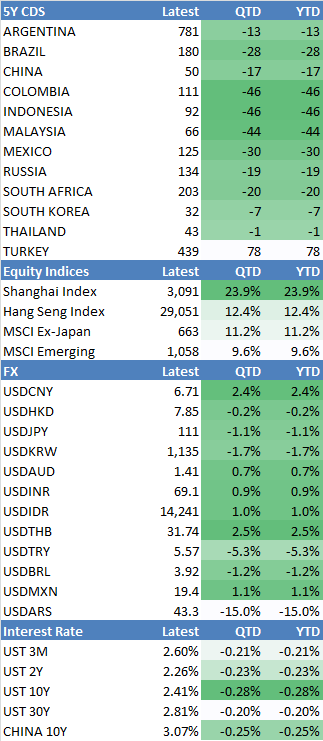
Figure 13: Economic and Market Data
The views expressed are the views of Value Partners Hong Kong Limited only and are subject to change based on market and other conditions. The information provided does not constitute investment advice and it should not be relied on as such. All material has been obtained from sources believed to be reliable as of the date of presentation, but its accuracy is not guaranteed. This material contains certain statements that may be deemed forward-looking statements. Please note that any such statements are not guarantees of any future performance and actual results or developments may differ materially from those projected.
This commentary has not been reviewed by the Securities and Futures Commission in Hong Kong. Issuer: Value Partners Hong Kong Limited.
For Singapore investors: This commentary has not been reviewed by Monetary Authority of Singapore. Value Partners Asset Management Singapore Pte Ltd, Singapore Company Registration No. 200808225G.